Canopy is a Python IDE (integrated development environment) provided by Enthought Scientific Computing Solutions. It provides a simple code editor, runtime environment and easy way for installation of hundreds of scientific Python packages.
Here is how to get it up and running.
Installation on Windows/Mac/Linux
These installation instructions have been tested on Windows 10, and Ubuntu 16.04, but should work also for other operating systems.
-
Go to the website for Canopy: https://www.enthought.com/products/canopy/
and select Canopy from the Downloads list (at the very top of the page) or go directly to the Downloads page. -
Select the version with the highest number for the operating system that you are using. Unless you are certain that you have an older machine still running a 32 bit system, you should pick the 64-bit version of the operating system, for example, Windows[64-bit]. Currently the highest version of Canopy is 3.5.
-
The download may take a while since the file is fairly large. Once the download completes, go to your
Downloadsdirectory and you should see a file calledcanopy-2.1.3.win-x86_64-cp35(keep in mind that the name might be slightly different depending on the operating system and the version number.
Double click on that file to run the installer. (There is a chance that your operating system will ask you if you want to run the installer right after the download completes. If that is the case, you do not need to find the file and run it yourself.) -
You can now run Canopy. To start it go to your application menu or use the shortcut that was placed on your Desktop.
When you run the program for the first time, it needs to finish the installation process, so it may take a bit of extra time. -
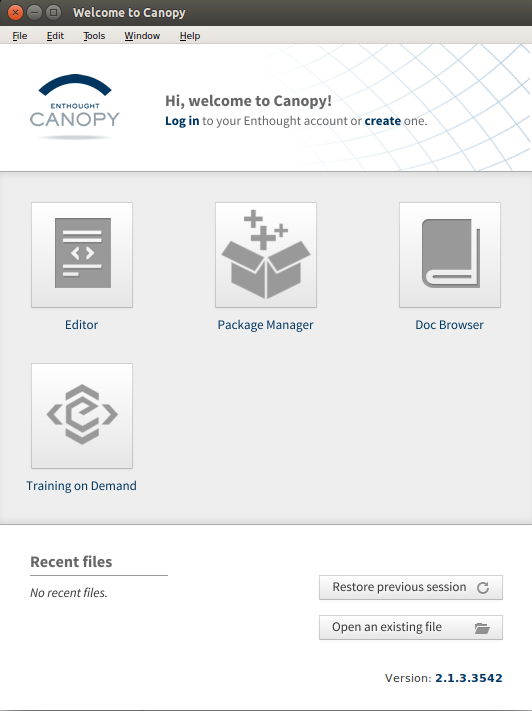
You should be looking at the following window once Canopy starts:
Updateing and adding packages
Before starting to code, we will make sure that all the Python packages are up to date and we will install some additional packages needed to produce plots and graphs.
-
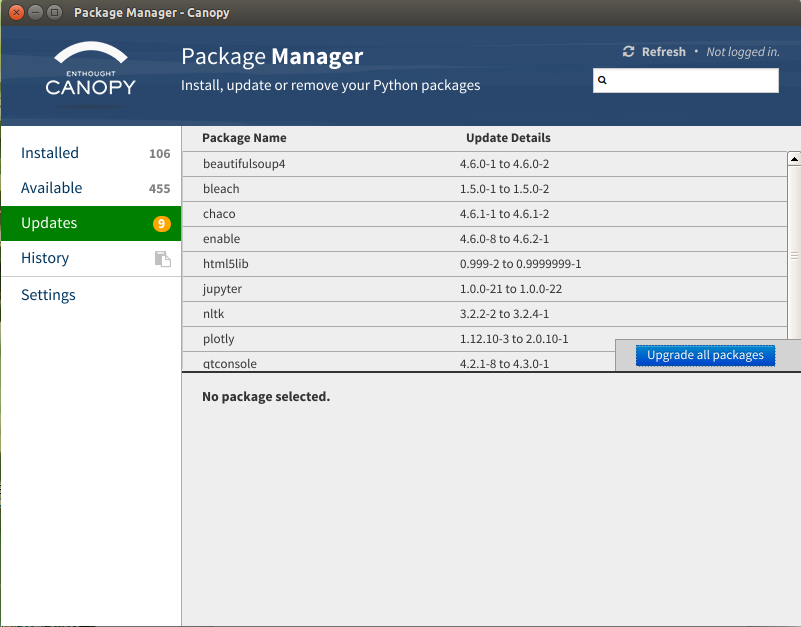
Select Package Manager from he above screen. Pick Updates from the menu on the left hand side. The number next to it, indicates the number of packages that can be updated. Click on the Upgrade all packages link (shown with a blue background in the image below) and accept the list of packages to be upgraded when prompted.
-
Don't leave the Package Manager just yet. Pick Available from the menu on the left hand side. Use the search window (upper right corner) and search for "qt". For each of the packages listed in the results, select the package name and click Install (the button on a blue background below).
Running your first test program
To make sure that the required package installed correctly, close the Package Manager and open the Editor to run the test program.
- From the menu select File, New and Python 3 File (or use the first icon in the toolbar; it should be the Create new file icon).
- Save the empty file to a location for your Python programs (it should not be directly on your Desktop, but rather in a directory dedicated for your coursework).
From the menu select File, Save As, browse to an appropriate directory and enter the
name of the file as
test1.py- note that the extension.pyis very important here! -
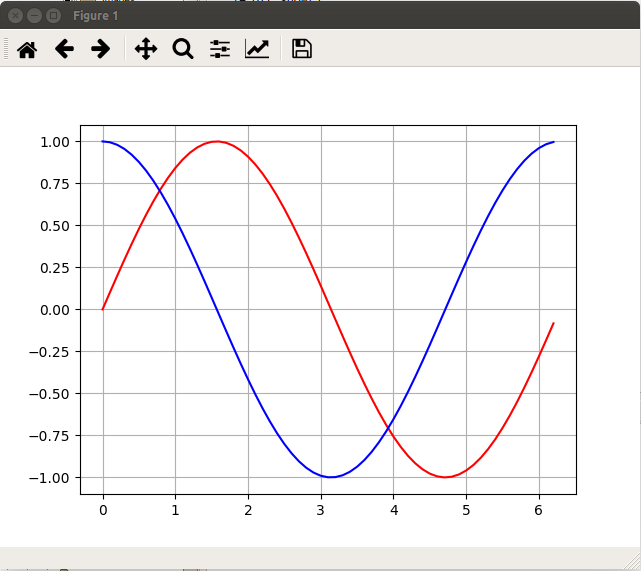
Paste the following text as the content of the file. Make sure that you copy the text exactly and that there is no white spaces at the beginning of the lines in the code editor.
import matplotlib.pyplot as plt from numpy import arange, sin, cos, pi x = arange(0, 2*pi, 0.1) y1 = sin(x) y2 = cos(x) plt.plot(x,y1,'r') plt.plot(x,y2,'b') plt.grid(True) plt.show() -
Run the program by either selecting from the menu Run followed by Run File or clicking on the green arrow icon labeled Run the current file in the toolbar. You should see the following plot generated by the program.